

WSE-3 compatibility
Instruction traces in the SDK GUI are supported on WSE-3 starting with SDK 2.10. On earlier SDKs (1.4 and below) the GUI runs against a WSE-3 simulator but the instruction-trace pane will be empty; the timeline, routes, and landing logs still work. Other panes (timeline, routes, colors, landing logs) are supported on both WSE-2 and WSE-3 across all current SDK versions.
Instruction traces in the SDK GUI are supported on WSE-3 starting with SDK 2.10. On earlier SDKs (1.4 and below) the GUI runs against a WSE-3 simulator but the instruction-trace pane will be empty; the timeline, routes, and landing logs still work. Other panes (timeline, routes, colors, landing logs) are supported on both WSE-2 and WSE-3 across all current SDK versions.
sdk_debug_shell visualize, pointing to your test artifact directory. Open the URL that the command shows.
The diagram below shows a summary of the functionality:
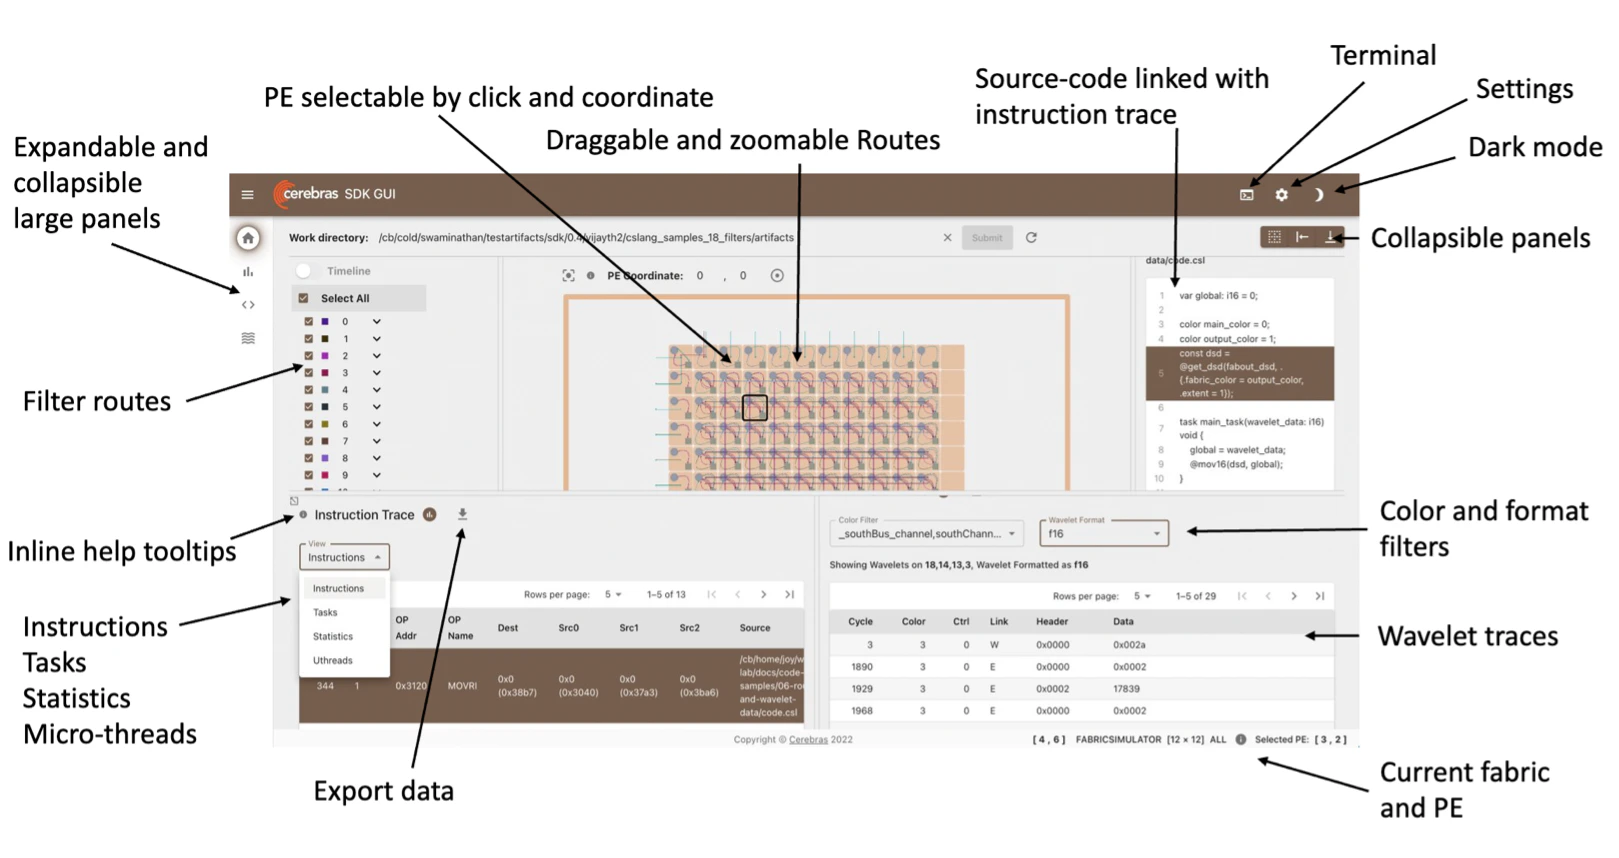
Change Directory
If you wish to load a different directory, enter the new directory and click Submit.
Dark and Light Modes
To switch between dark and light modes, click the icons at the top right. Switch to dark mode:

Routes and Colors
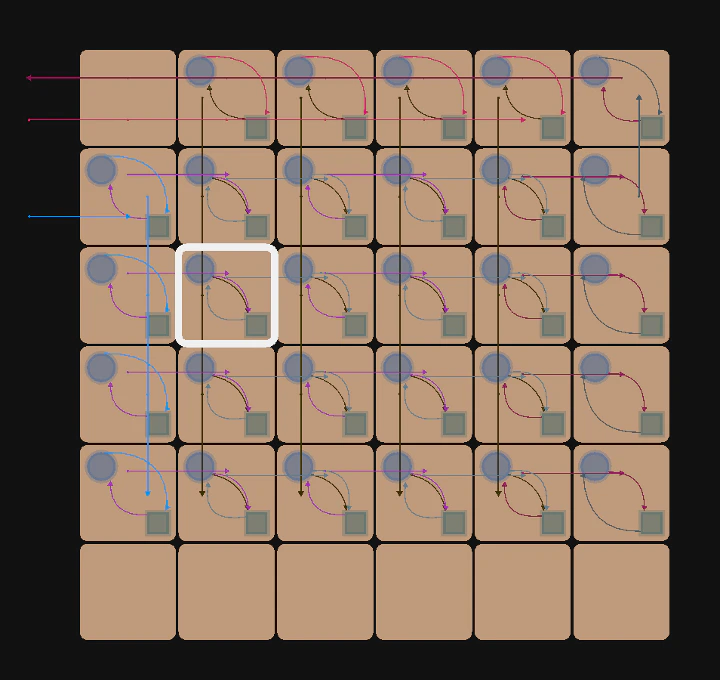
To view the routes on the fabric, select the color IDs. To view all the routes, click Select All.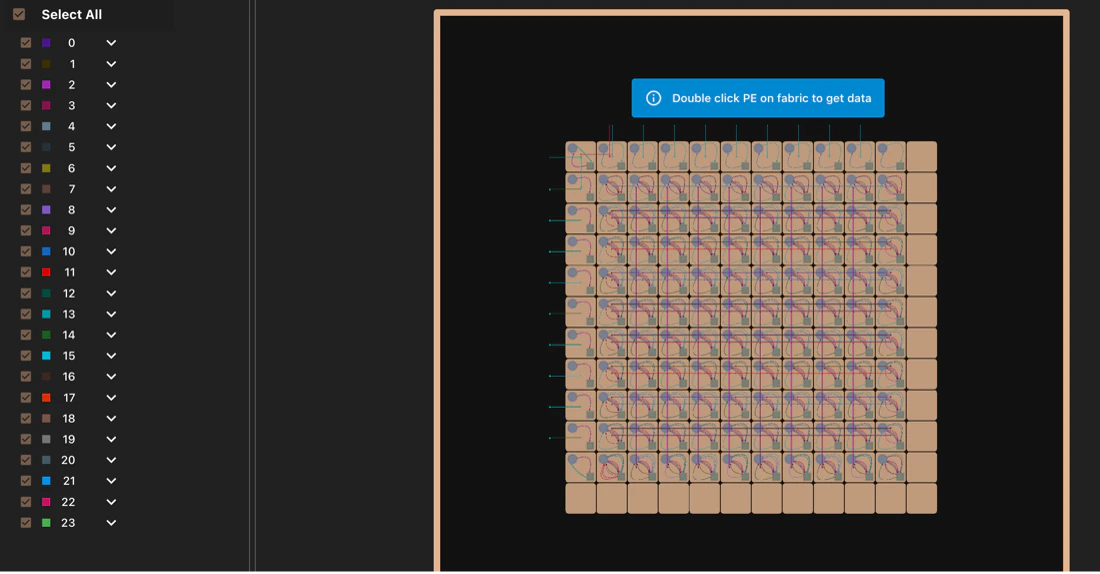
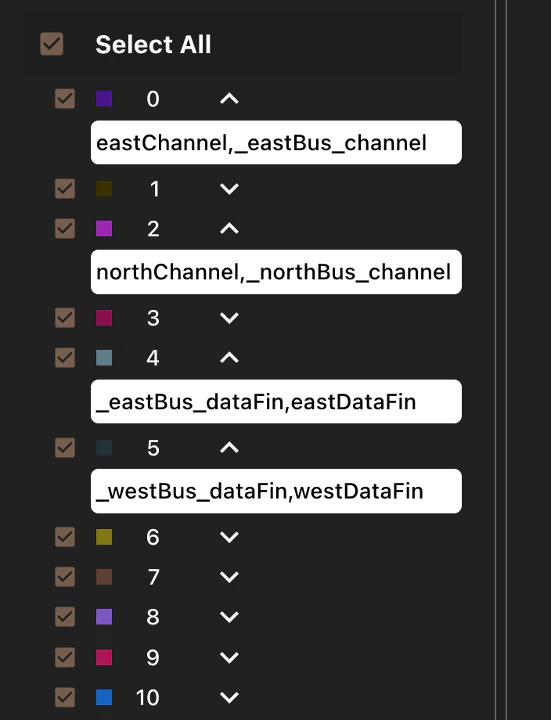
Fabric View
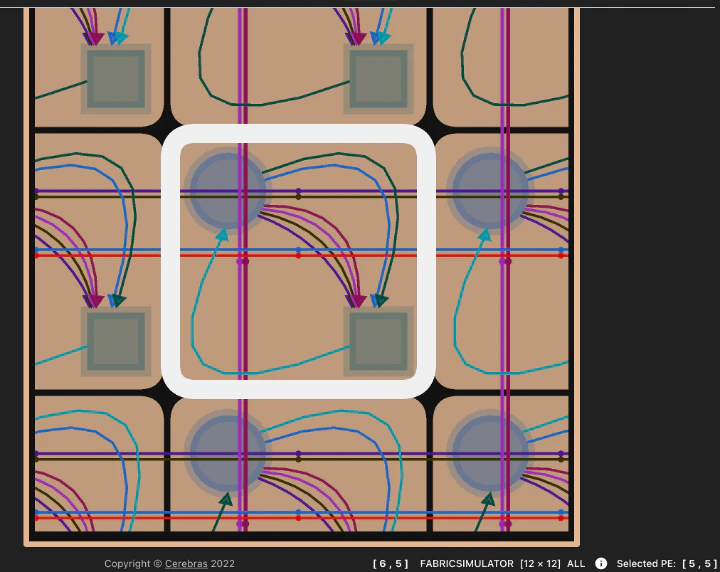
Move the fabric around by dragging it. To zoom in and out of the fabric, use the mouse scroll functionality.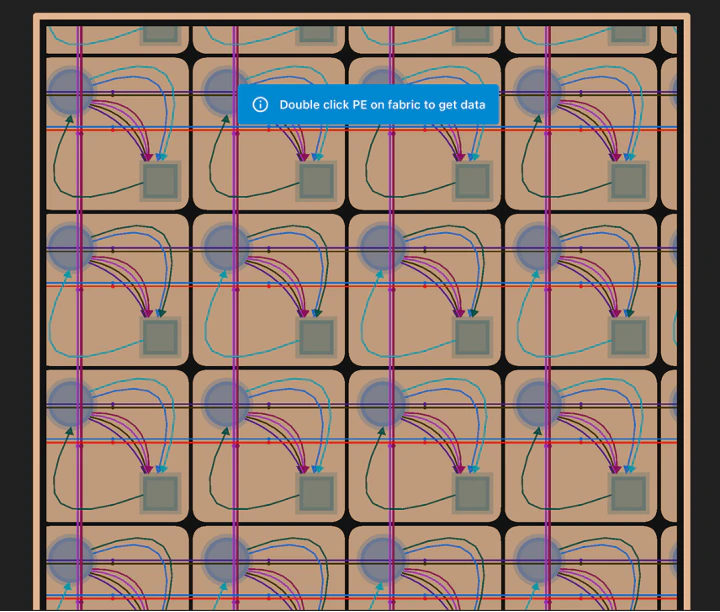
- To recenter the fabric, click the Re-center button.

- To zoom into a particular process element (PE), enter a specific PE Coordinate.



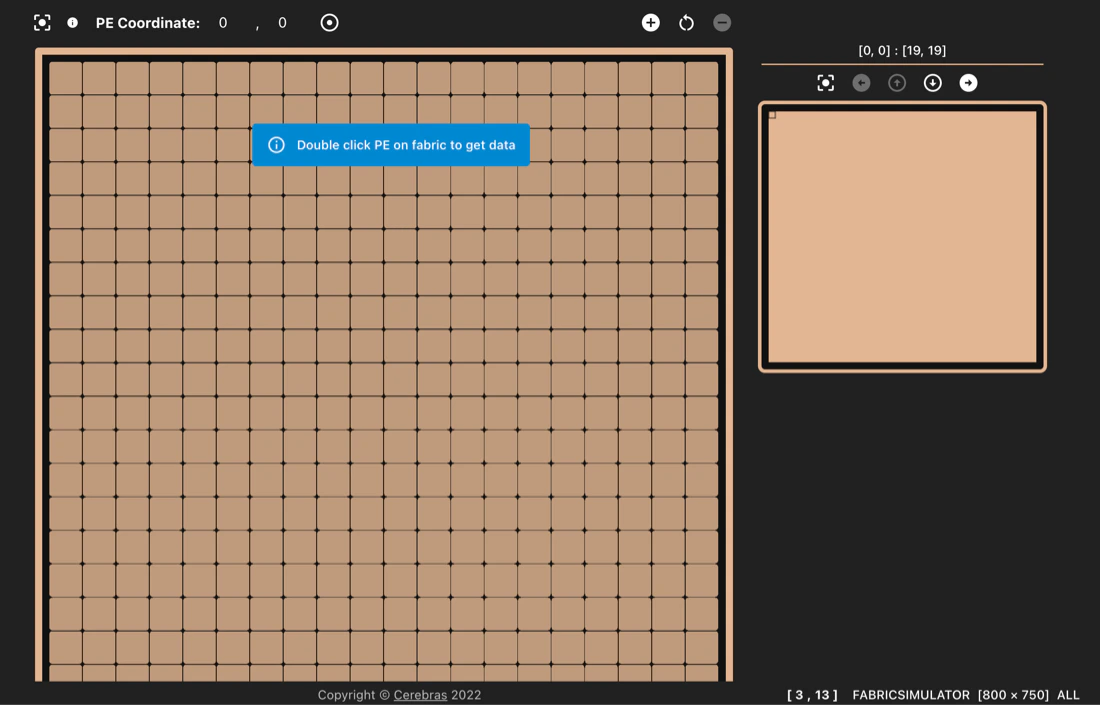


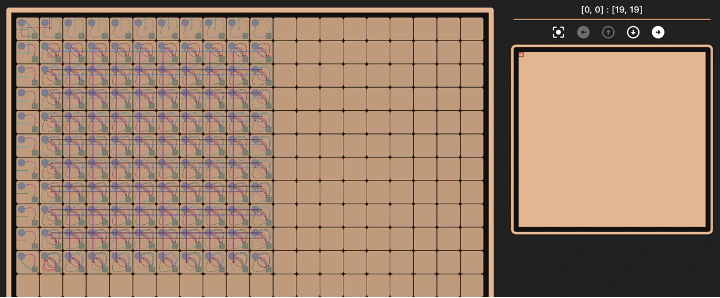


The fabric cannot be moved by dragging for a scalable fabric view.
Instruction Traces
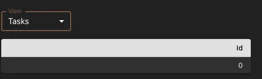
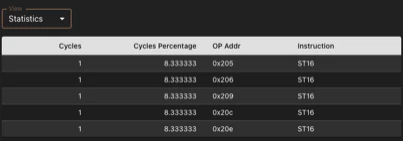
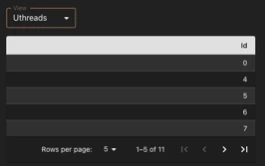
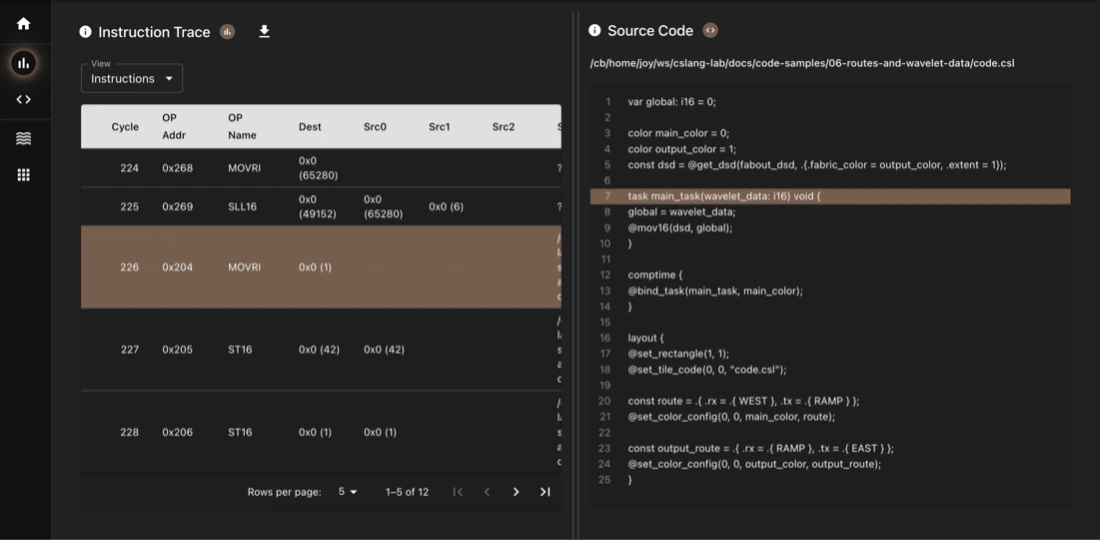
You can view the instructions, tasks, statistics, uthreads or micro threads from the instruction trace panel. To view the instructions, from the dropdown list, select Instructions.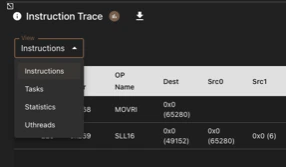
Source Code
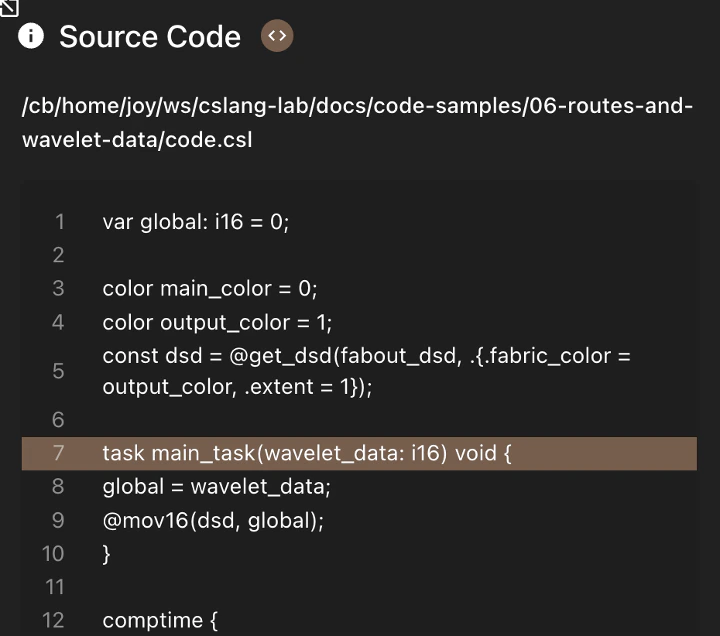
To view the source code for an instruction, follow the steps below:- To view all the instructions, in the instruction trace panel, select Instructions.
- Click an instruction that has the source code file and line number.
Wavelet Traces
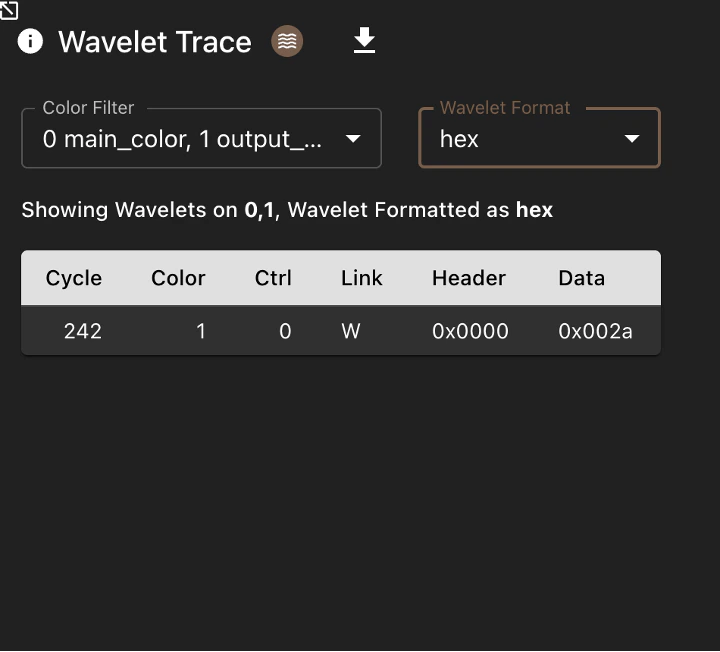
Wavelet traces are displayed in the wavelet trace panel.- From the color dropdown, select a color. To select all colors, click Select All.
- From the wavelet format dropdown, select a format. This formats the header and data fields of the wavelet.
Timeline: Wavelet Traces
To show the timeline for a wavelet, click a color and a PE. The timeline for wavelet appears in the bottom pane.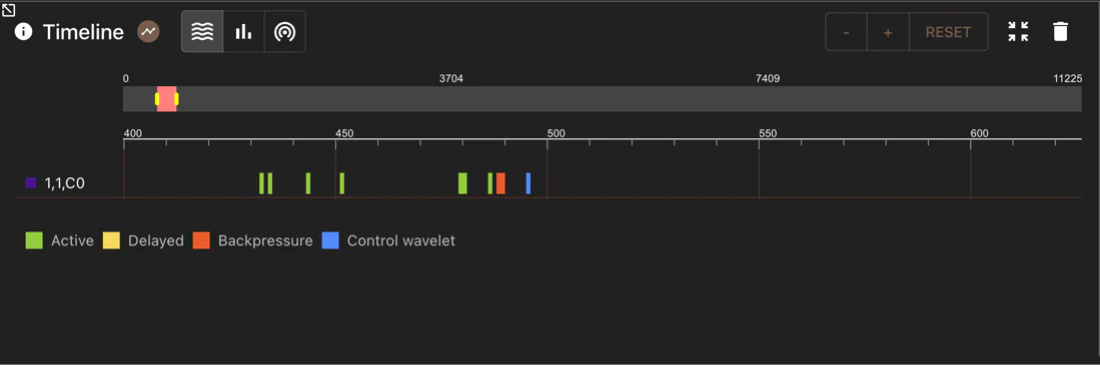
Legend Terminology
- Active: Sender PE can send a wavelet without any backpressure or delay. Shown as green.
- Delayed: The switch/router (represented by the circle) output is congested due to multiple input sources. Shown as yellow.
- Backpressure: Destination PE is busy and cannot receive any wavelets from sender PE. The sender PE is back-pressured. Shown as red.
- Idle: There is no wavelet in the router. Shown as empty spaces in the timeline for a PE.
- Wavelet Type:
: + Control wavelet: Wavelet that changes control, such as routing to a compute element (CE). Shown as blue.
- Data wavelet: Wavelet that sends data. The active, delayed, and back-pressured wavelets are data wavelets.
Timeline: Instruction Traces
To view the timeline of instruction traces, click the instruction trace icon next to the header title.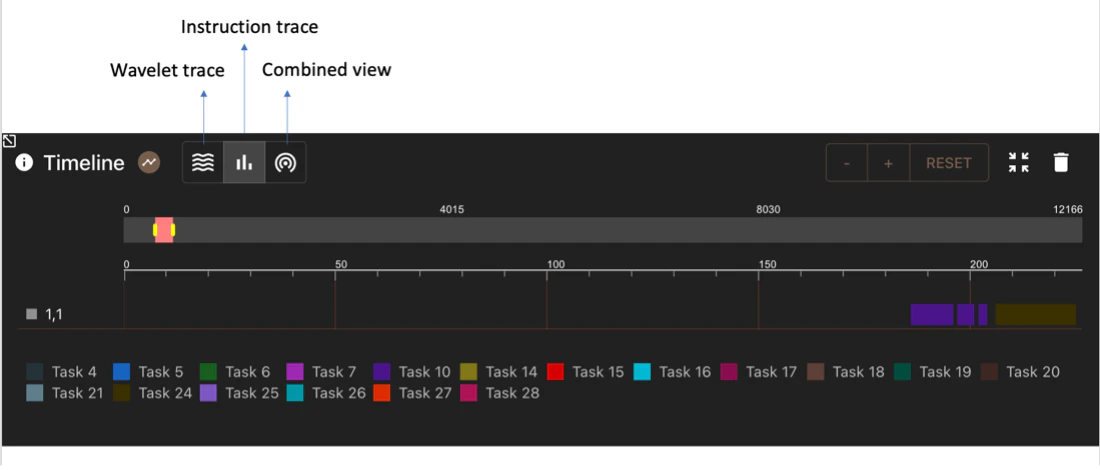
Timeline: Combined View
Combined view shows both the wavelet traces and the instruction traces associated with the PE and color. Whenever a new selection is made, two items are added to the timeline area: one corresponding to the timeline of wavelet traces, and the other corresponding to the timeline of instruction traces.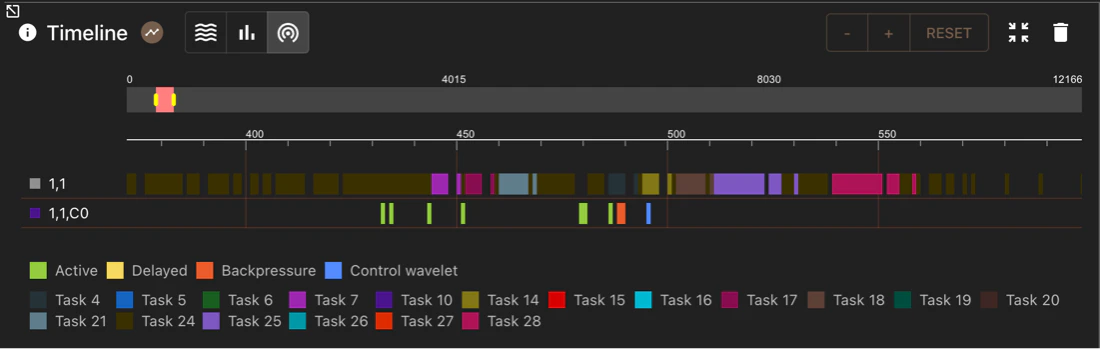
Timeline: Navigation Controls
You can delete a PE from the timeline view. Hover over the PE and click the “trash” icon. To clear all the PEs from the timeline view, click the “trash” icon in the upper-right corner. By default, the timeline view shows only the first few hundred cycles. Not all cycles are shown in the initial view. To view the left or right, you can scroll the timeline. There is a red rectangular bar above the timeline area. The red bar represents the current view area. Dragging the red bar left or right moves the timeline view correspondingly. You can also zoom out to show more cycles in the view or zoom in to show fewer cycles in the view.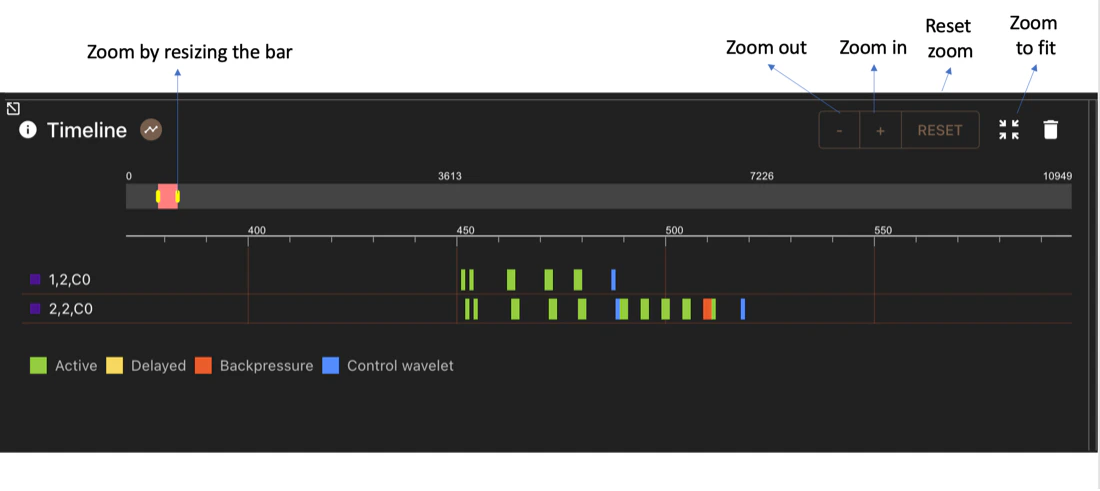
Debug Pane
To show the details in the debug pane to the right, hover over a timeline item. For wavelets, the detail pane shows the cycles that the wavelet took to reach the next PE, a wavelet ID that is shown for debug purposes, the status of the wavelet, the direction (East, West, North, South), and whether it is a control wavelet. The pane also shows index and data fields.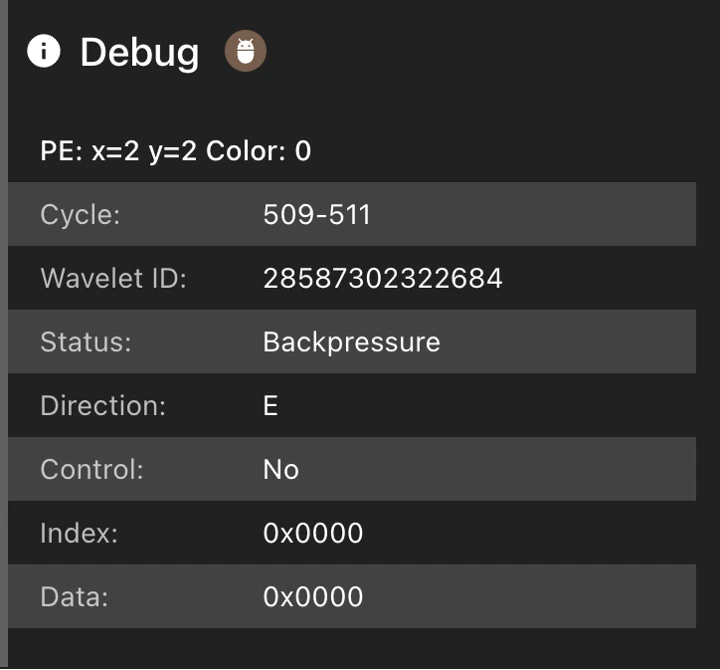
Settings Dialog
You can enter a new work directory in the textbox at the top of the application. When you click the Submit button, the Settings Dialog appears.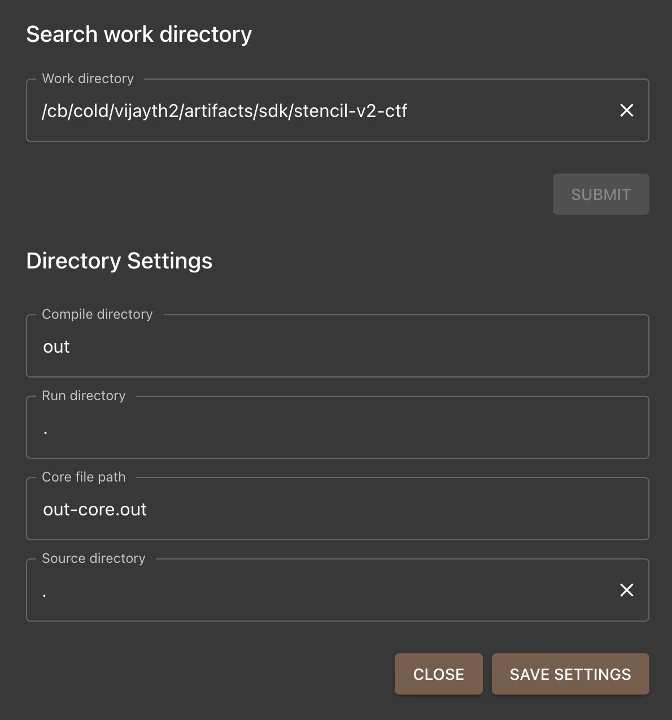
Terminal
To view the Terminal page, click the terminal icon on the top right. This page provides a UNIX command console for the root folder where the SDK-GUI web server is running.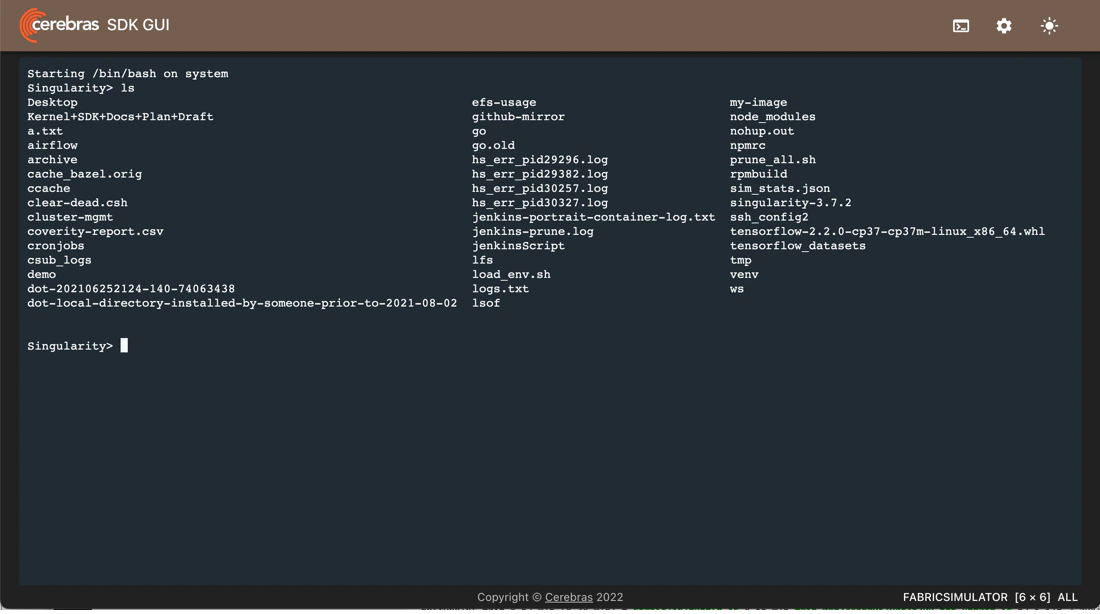
Panes
You can toggle panes on and off.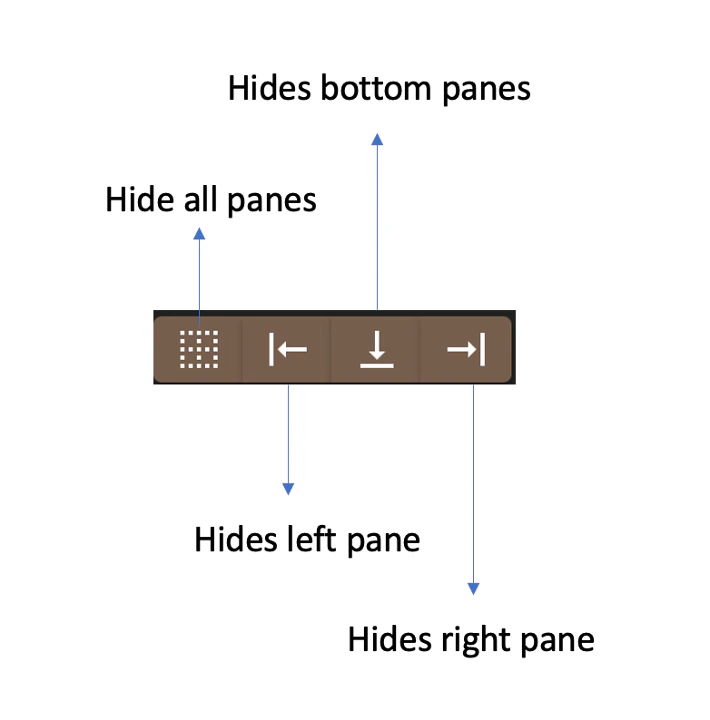
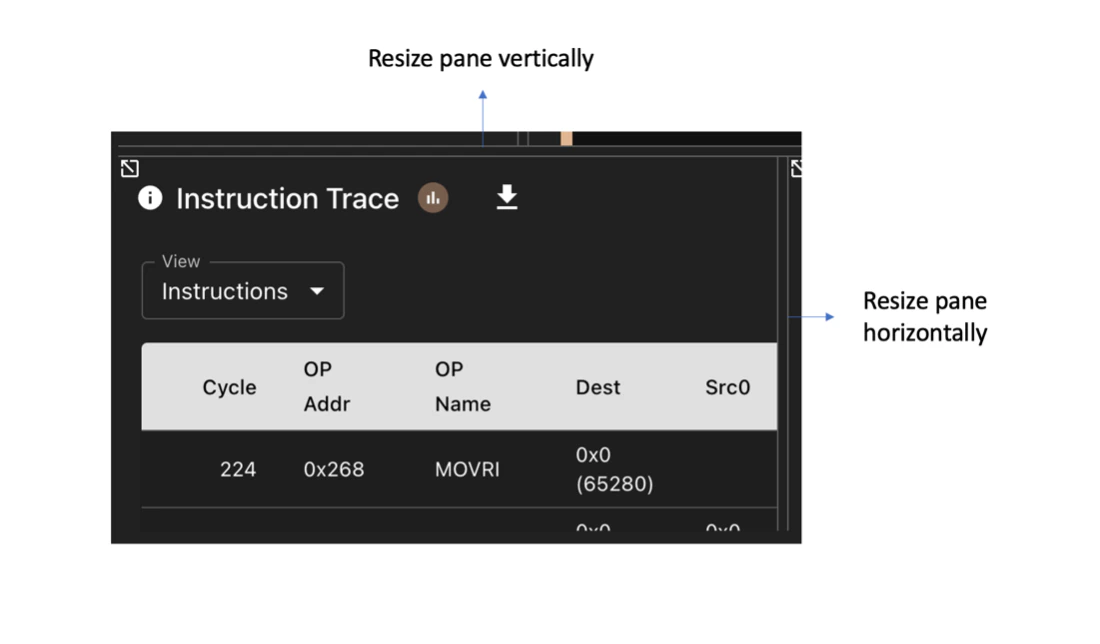
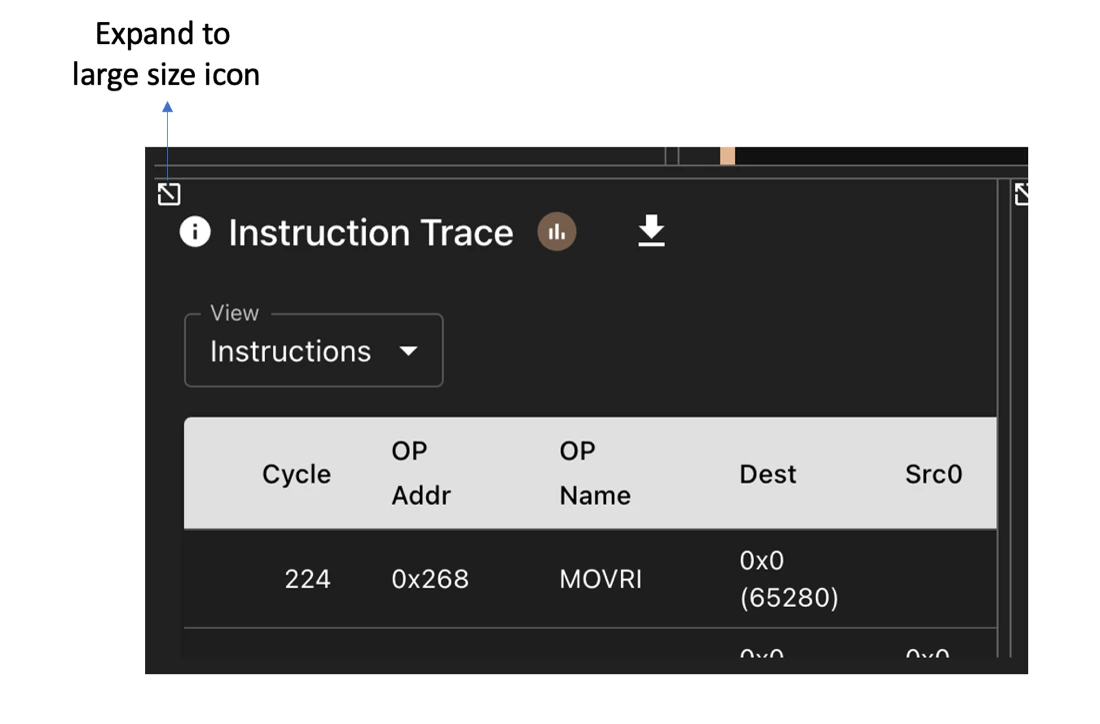
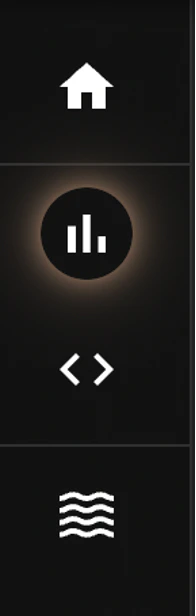
- The first icon (Home) shows the original view with all the panes.
- The second icon shows the instructions trace pane along with the source code pane.
- The third icon shows the source code pane.
- The fourth icon shows the wavelet trace pane.